3. Zooming in on data
This chapter will show how you can zoom in on your data. This is a common feature of programs for data analysis. This is the first tutorial that will make use of classes. If you are new to Python you might want to review some simple examples first before reading on (See Further Reading at bottom of page).
3.1. Simple Zoom-Subplot
In the first example we will create a simple collection of random points, with random size and random color. Zooming on some of the points will create a rectangle that highlights the zoomed area. The zoom-graph itself will show the points enlarged, as we don’t want to produce mileading precision (This will be useful in the example with error bars).
To get you motivated or if you want to try to build the program yourself the next figure will show the finished example I came up with.
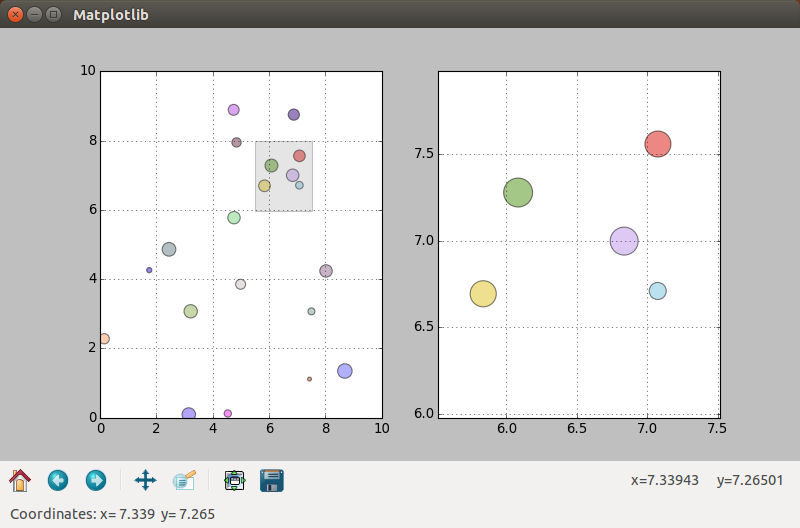
The left window shows the original data and the right window the zoomed data. The zoomed area is highlighted and the points are enlarged according to the zoomfactor.
At the beginning of the code we will import the usual modules. New is the import of the Rectangle function which we will use to plot a rectangle within the graph.
#!/usr/bin/python3

from gi.repository import Gtk
from matplotlib.figure import Figure
from numpy import random
#Possibly this rendering backend is broken currently
#from matplotlib.backends.backend_gtk3agg import FigureCanvasGTK3Agg as FigureCanvas
from matplotlib.backends.backend_gtk3cairo import FigureCanvasGTK3Cairo as FigureCanvas    from matplotlib.backends.backend_gtk3 import NavigationToolbar2GTK3 as NavigationToolbar
from matplotlib.patches import Rectangle
The DrawPoints class will do most of the work in this example. On init, we will define some variables and set up the 2 subplots. Each subplot has its own drawing function, which clears the subplot, before drawing. The zoom function recycles the draw and drawzoom function.
class DrawPoints:
    '''Creates random points, 2 axis on 1 figure on 1 canvas on init. Allows for drawing and zooming of points.'''
    def __init__(self):
        self.n = 20
        self.xrand = random.rand(1,self.n)*10
        self.yrand = random.rand(1,self.n)*10
        self.randsize = random.rand(1,self.n)*200
        self.randcolor = random.rand(self.n,3)

        self.fig = Figure(figsize=(10,10), dpi=80)
        self.ax = self.fig.add_subplot(121)
        self.axzoom = self.fig.add_subplot(122)
        self.canvas = FigureCanvas(self.fig)
    def draw(self):
        '''Draws the ax-subplot'''
        self.ax.cla()
        self.ax.grid(True)
        self.ax.set_xlim(0,10)
        self.ax.set_ylim(0,10)
        self.ax.scatter(self.xrand, self.yrand, marker='o', s=self.randsize, c=self.randcolor, alpha=0.5)
    def drawzoom(self):
        '''Draws the axzoom-suplot'''
        self.axzoom.cla()
        self.axzoom.grid(True)
        self.axzoom.set_xlim(self.x-1, self.x+1)
        self.axzoom.set_ylim(self.y-1, self.y+1)
        self.axzoom.scatter(self.xrand, self.yrand, marker='o', s=self.randsize*5, c=self.randcolor, alpha=0.5)
    def zoom(self, x, y):
        '''Adds a rectangle to the zoomed area of the ax-graph and updates the axzoom-graph'''
        self.x = x
        self.y = y
        self.draw()
        self.drawzoom()
        self.ax.add_patch(Rectangle((x - 1, y - 1), 2, 2, facecolor="grey", alpha=0.2))
        self.fig.canvas.draw()
The function updatecursorposition is activated when the mouse moves over the graph. The x and y coordinates are then send to the GtkStatusbar.
def updatecursorposition(event):
    '''When cursor inside plot, get position and print to statusbar'''
    if event.inaxes:
        x = event.xdata
        y = event.ydata
        statbar.push(1, ("Coordinates:" + " x= " + str(round(x,3)) + "  y= " + str(round(y,3))))
The updatezoom function is activated when the mouse is clicked inside the graph. It then checks for the left mouse button, and if the event is a number (meaning not the Python None-Type). Then the coordinates are forwarded to the zoom function (Later in the program we will create an instance of the class called points() and that is why we call points.zoom()).
def updatezoom(event):
    '''When mouse is right-clicked on the canvas get the coordiantes and send them to points.zoom'''
    if event.button!=1: return
    if (event.xdata is None): return
    x,y = event.xdata, event.ydata
    points.zoom(x,y)
The rest of the program goes through the usual setting up, of the Gtk window and the containers. We also define an instance of the DrawPoints class and call points.draw() to draw the initial graph. Two event triggers are connected with the canvas (*points.fig.canvas) and the appropriate functions are called (updatecursorposition for mouse motion and updatezoom for mouse clicks)
window = Gtk.Window()
window.connect("delete-event", Gtk.main_quit)
window.set_default_size(800, 500)
window.set_title('Matplotlib')

box = Gtk.Box(orientation=Gtk.Orientation.VERTICAL)
window.add(box)

points = DrawPoints()
points.draw()

box.pack_start(points.canvas, True, True, 0)

toolbar = NavigationToolbar(points.canvas, window)
box.pack_start(toolbar, False, True, 0)

statbar = Gtk.Statusbar()
box.pack_start(statbar, False, True, 0)

points.fig.canvas.mpl_connect('motion_notify_event', updatecursorposition)
points.fig.canvas.mpl_connect('button_press_event', updatezoom)

window.show_all()
Gtk.main()
This is the code of the whole example:
#!/usr/bin/python3

from gi.repository import Gtk
from matplotlib.figure import Figure
from numpy import random
#Possibly this rendering backend is broken currently
#from matplotlib.backends.backend_gtk3agg import FigureCanvasGTK3Agg as FigureCanvas
from matplotlib.backends.backend_gtk3cairo import FigureCanvasGTK3Cairo as FigureCanvas    from matplotlib.backends.backend_gtk3 import NavigationToolbar2GTK3 as NavigationToolbar
from matplotlib.patches import Rectangle

class DrawPoints:
    '''Creates random points, 2 axis on 1 figure on 1 canvas on init. Allows for drawing and zooming of points.'''
    def __init__(self):
        self.n = 20
        self.xrand = random.rand(1,self.n)*10
        self.yrand = random.rand(1,self.n)*10
        self.randsize = random.rand(1,self.n)*200
        self.randcolor = random.rand(self.n,3)

        self.fig = Figure(figsize=(10,10), dpi=80)
        self.ax = self.fig.add_subplot(121)
        self.axzoom = self.fig.add_subplot(122)
        self.canvas = FigureCanvas(self.fig)
    def draw(self):
        '''Draws the ax-subplot'''
        self.ax.cla()
        self.ax.grid(True)
        self.ax.set_xlim(0,10)
        self.ax.set_ylim(0,10)
        self.ax.scatter(self.xrand, self.yrand, marker='o', s=self.randsize, c=self.randcolor, alpha=0.5)
    def drawzoom(self):
        '''Draws the axzoom-suplot'''
        self.axzoom.cla()
        self.axzoom.grid(True)
        self.axzoom.set_xlim(self.x-1, self.x+1)
        self.axzoom.set_ylim(self.y-1, self.y+1)
        self.axzoom.scatter(self.xrand, self.yrand, marker='o', s=self.randsize*5, c=self.randcolor, alpha=0.5)
    def zoom(self, x, y):
        '''Adds a rectangle to the zoomed area of the ax-graph and updates the axzoom-graph'''
        self.x = x
        self.y = y
        self.draw()
        self.drawzoom()
        self.ax.add_patch(Rectangle((x - 1, y - 1), 2, 2, facecolor="grey", alpha=0.2))
        self.fig.canvas.draw()

def updatecursorposition(event):
    '''When cursor inside plot, get position and print to statusbar'''
    if event.inaxes:
        x = event.xdata
        y = event.ydata
        statbar.push(1, ("Coordinates:" + " x= " + str(round(x,3)) + "  y= " + str(round(y,3))))

def updatezoom(event):
    '''When mouse is right-clicked on the canvas get the coordiantes and send them to points.zoom'''
    if event.button!=1: return
    if (event.xdata is None): return
    x,y = event.xdata, event.ydata
    points.zoom(x,y)

window = Gtk.Window()
window.connect("delete-event", Gtk.main_quit)
window.set_default_size(800, 500)
window.set_title('Matplotlib')

box = Gtk.Box(orientation=Gtk.Orientation.VERTICAL)
window.add(box)

points = DrawPoints()
points.draw()

box.pack_start(points.canvas, True, True, 0)

toolbar = NavigationToolbar(points.canvas, window)
box.pack_start(toolbar, False, True, 0)

statbar = Gtk.Statusbar()
box.pack_start(statbar, False, True, 0)

points.fig.canvas.mpl_connect('motion_notify_event', updatecursorposition)
points.fig.canvas.mpl_connect('button_press_event', updatezoom)

window.show_all()
Gtk.main()
3.1.1. Simple Zoom-Subplot with Glade
This example doesn’t require any additional Glade structures than the examples before. Just another container for the GtkToolbar. You should have no trouble converting the example yourself.
3.2. Further Reading
- The Python Tutorial: Classes
- Matplotlib API Patch collection example