4. Entering data
In this chapter we will build the first program that will allow data to be entered and immedietly graphed. The data will be (temporarily) stored in a Gtk.ListStore and viewed and changed by using Gtk.TreeView. A program like this might be useful for class-room demonstrations, but in the next chapters we will add data input and output to these examples to build fully fledged data processing programs.
4.1. Point plotting with Gtk.TreeView
The first example we will build will consist of a table (a GTKTreeView) and a Matplotlib-graph. The table has two columns for x-y-coordinates which will be plotted in the graph.
The program requires the following imports:
#!/usr/bin/python3

from gi.repository import Gtk
from matplotlib.figure import Figure
#Possibly this rendering backend is broken currently
#from matplotlib.backends.backend_gtk3agg import FigureCanvasGTK3Agg as FigureCanvas
from matplotlib.backends.backend_gtk3cairo import FigureCanvasGTK3Cairo as FigureCanvas
I decided to put the whole program into a class. First we have to set up the window, the layout and a Gtk.Toolbar. The two lines starting with self.context ensure that the toolbar will be styled similar to your operating system.
class MainClass():
    def __init__(self):
        self.window = Gtk.Window()
        self.window.set_default_size(800, 500)
        self.boxvertical = Gtk.Box(orientation=Gtk.Orientation.VERTICAL)
        self.window.add(self.boxvertical)

        self.toolbar = Gtk.Toolbar()
        self.context = self.toolbar.get_style_context()
        self.context.add_class(Gtk.STYLE_CLASS_PRIMARY_TOOLBAR)
        self.boxvertical.pack_start(self.toolbar, False, False, 0)
Then we have to create two buttons and add them to the toolbar on position 0 and 1. Then add the toolbar to our layout. The two buttons are also connected to their respective function when they are clicked.
self.addbutton = Gtk.ToolButton(Gtk.STOCK_ADD)
self.removebutton = Gtk.ToolButton(Gtk.STOCK_REMOVE)

self.toolbar.insert(self.addbutton, 0)
self.toolbar.insert(self.removebutton, 1)

self.addbutton.connect("clicked", self.addrow)
self.removebutton.connect("clicked", self.removerow)

self.box = Gtk.Box()
self.boxvertical.pack_start(self.box, True, True, 0)
Next we set up the figure and add it to the layout.
self.fig = Figure(figsize=(10,10), dpi=80)
self.ax = self.fig.add_subplot(111)
self.canvas = FigureCanvas(self.fig)
self.box.pack_start(self.canvas, True, True, 0)
Next we will set up the Gtk.ListStore and the Gtk.TreeView, connect the columns to their respective function. We can also add two values to the columns, just that the graph and table won’t be empty on startup.
self.liststore = Gtk.ListStore(float, float)
self.treeview = Gtk.TreeView(model=self.liststore)
self.box.pack_start(self.treeview, False, True, 0)

self.xrenderer = Gtk.CellRendererText()
self.xrenderer.set_property("editable", True)
self.xcolumn = Gtk.TreeViewColumn("x-Value", self.xrenderer, text=0)
self.xcolumn.set_min_width(100)
self.xcolumn.set_alignment(0.5)
self.treeview.append_column(self.xcolumn)

self.yrenderer = Gtk.CellRendererText()
self.yrenderer.set_property("editable", True)
self.ycolumn = Gtk.TreeViewColumn("y-Value", self.yrenderer, text=1)
self.ycolumn.set_min_width(100)
self.ycolumn.set_alignment(0.5)
self.treeview.append_column(self.ycolumn)

self.xrenderer.connect("edited", self.xedited)
self.yrenderer.connect("edited", self.yedited)

self.liststore.append([2.35, 2.40])
self.liststore.append([3.45, 4.70])
The resetplot function clears the axis, resets the limits and recreates the grid:
def resetplot(self):
    self.ax.cla()
    self.ax.set_xlim(0,10)
    self.ax.set_ylim(0,10)
    self.ax.grid(True)
The plotpoints function calls the resetplot function and iterates over the rows of the liststore. For each row one point is created. Then the fig.canvas.draw() command updates the plot.
def plotpoints(self):
    self.resetplot()
    for row in self.liststore:
        self.ax.scatter(row[:1], row[1:], marker='o', s=50)
    self.fig.canvas.draw()
The xedited and yedited functions first ensure that the comma is conveerted to a ”.”, so Python can work with them. This is important so your program will work independent of the format of the decimal point. The value is then added to the Gtk.ListStore. Then the plotpoints function is called.
def xedited(self, widget, path, number):
    self.liststore[path][0] = float(number.replace(',', '.'))
    self.plotpoints()

def yedited(self, widget, path, number):
    self.liststore[path][1] = float(number.replace(',', '.'))
    self.plotpoints()
The addrow and removerow function appends or removes a row from the Gtk.ListStore. To remove a row, we first have to query which row is currently selected. Either action calls the plotpoints funtion.
def addrow(self, widget):
    self.liststore.append()
    self.plotpoints()

def removerow(self, widget):
    self.select = self.treeview.get_selection()
    self.model, self.treeiter = self.select.get_selected()
    if self.treeiter is not None:
        self.liststore.remove(self.treeiter)
    self.plotpoints()
The end of the code creates an instance of the MainClass, sets up the plot using resetplot and plots the initial points. We also have to connect the window to the delete-event, calls the window and starts the Gtk main loop.
mc = MainClass()
mc.resetplot()
mc.plotpoints()

mc.window.connect("delete-event", Gtk.main_quit)
mc.window.show_all()
Gtk.main()
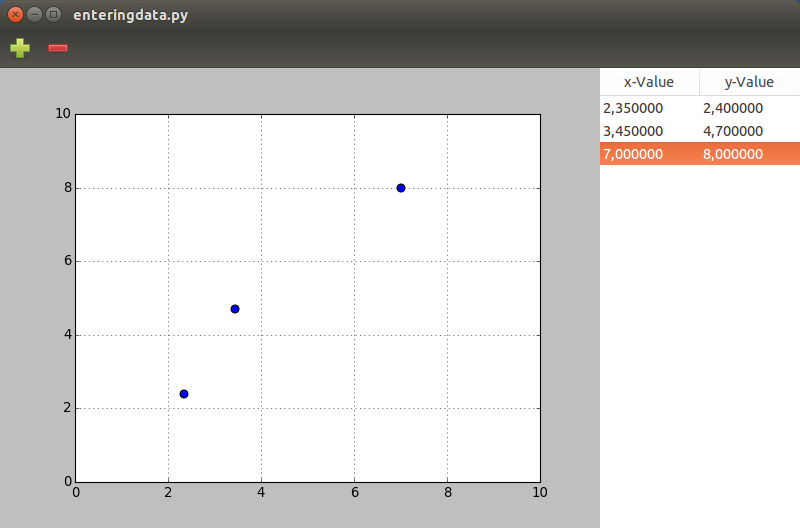
The finished program under Ubuntu looks like this:
4.2. Further Reading
- Python GTK+ 3 Tutorial: Tree and List Widgets
- AskUbuntu: What is the black header widget in some programs?